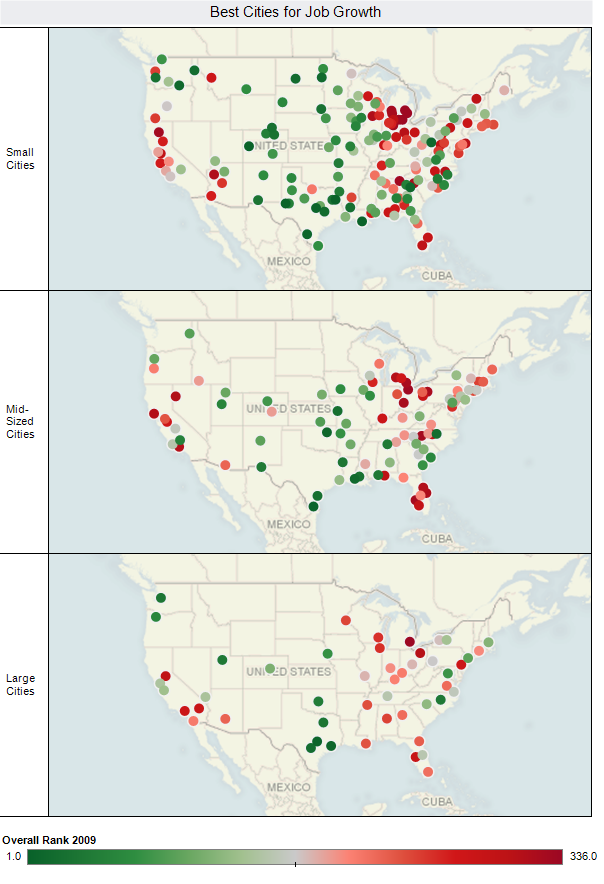
Here's some great maps of our annual Best Cities Rankings created by Robert Morton at Tableau Software. Robert used their software tool to plot a color coded point for each city in the rankings by size group, and immediate geographic patterns emerge:
Check out Robert's post for a map of the biggest gainers and losers from last year, and a rank change by size scatter plot of each place.