
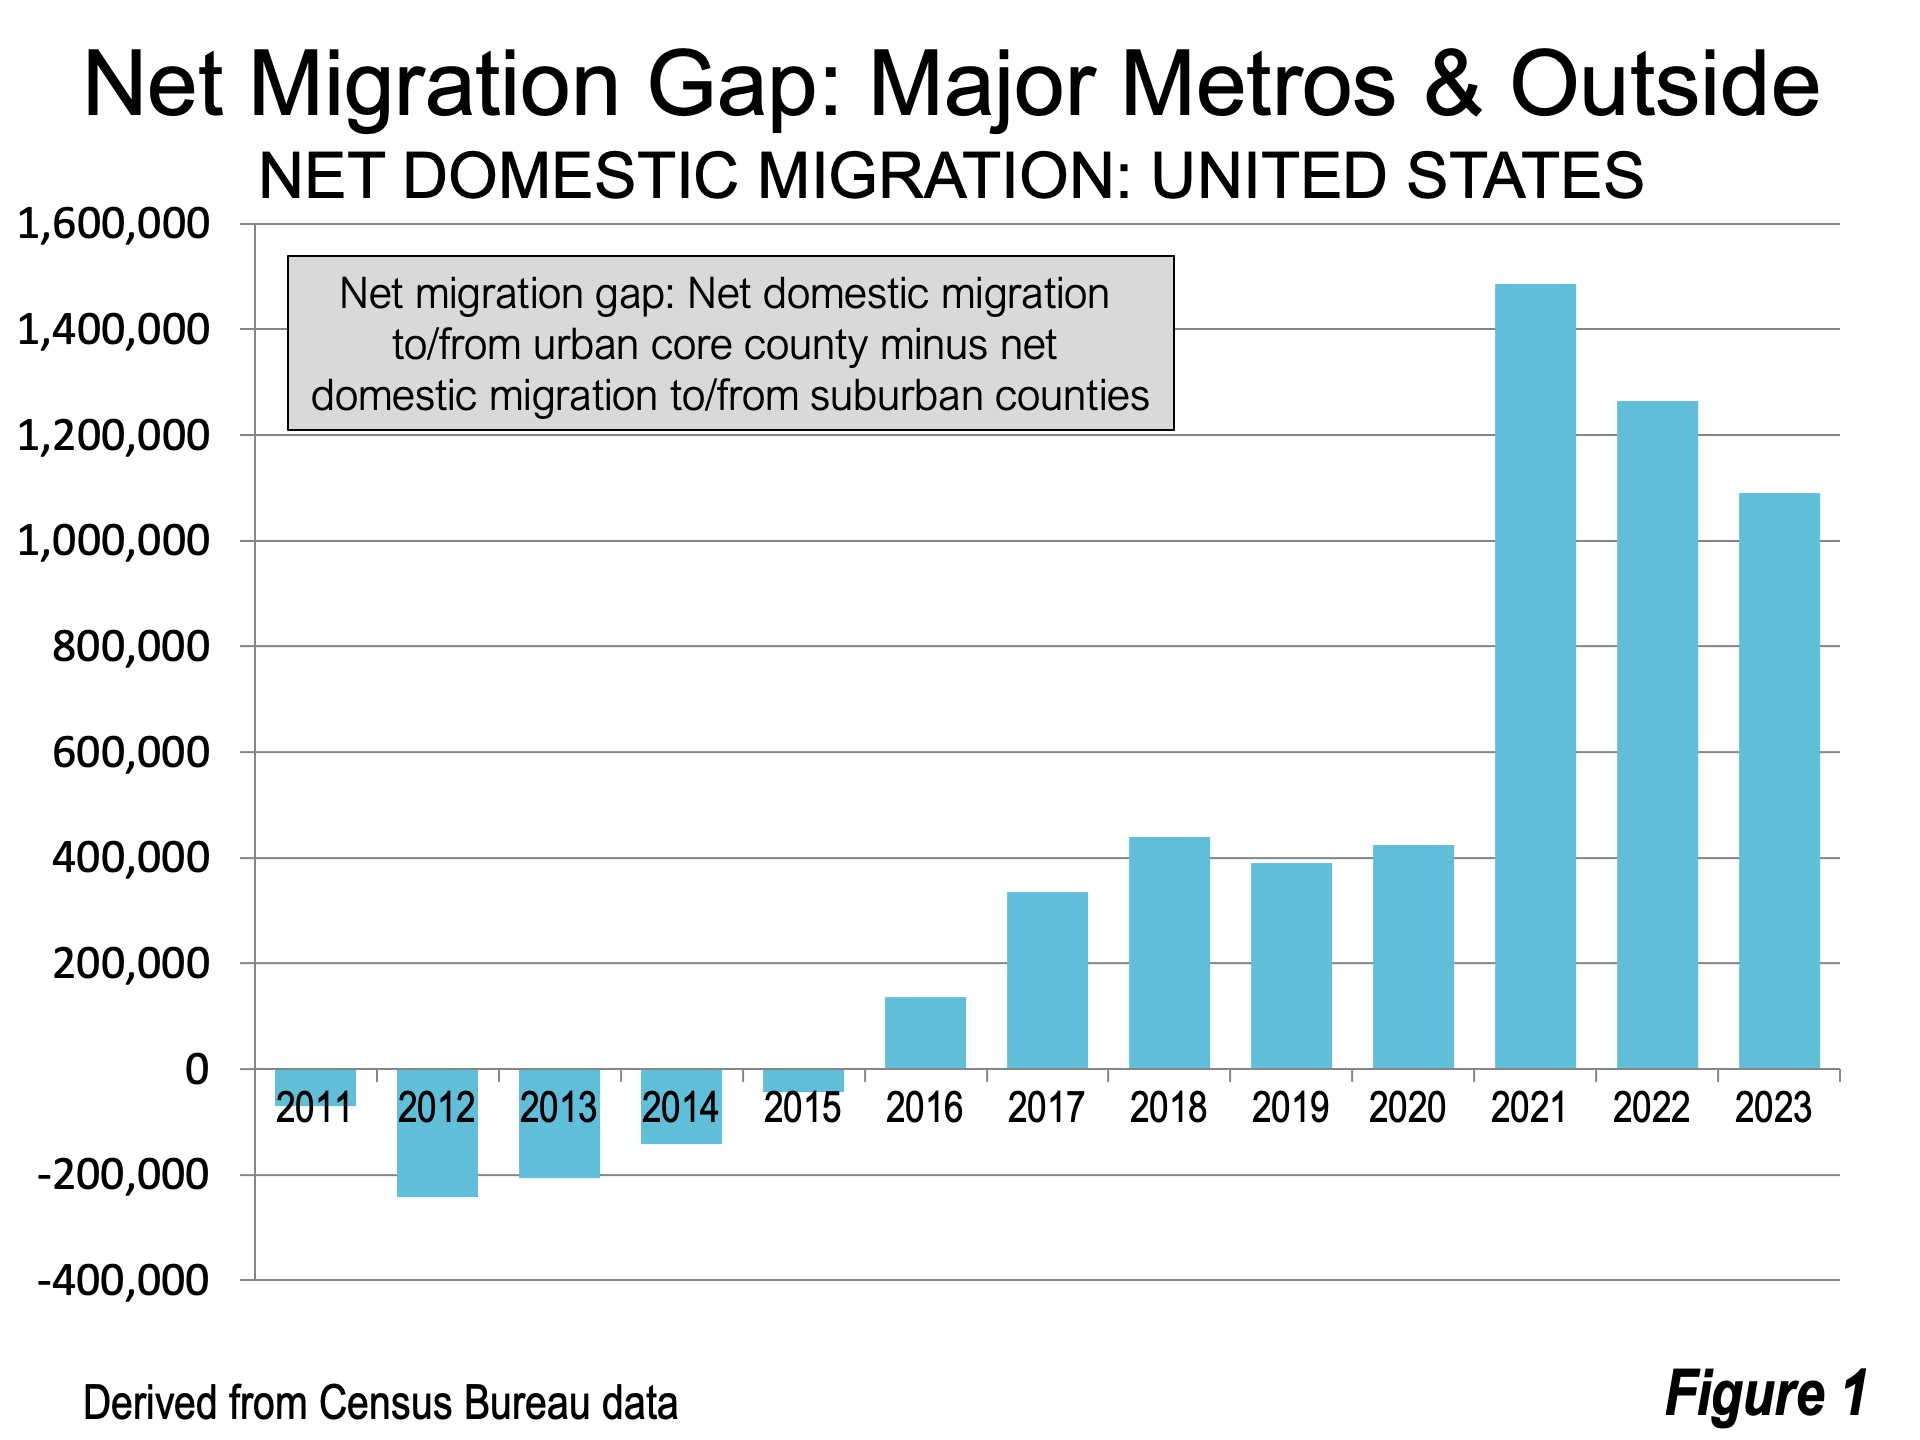
Moving Away from the Major Metros: The recent Census Bureau population estimates release revealed a massive shift of domestic migrants away from the major metropolitan areas (the 56 with more than 1,000,000 population) to the rest of the nation. In just three years (2021 through 2023), the major metros lost 1,920,000 net domestic migrants to other places .Relative to the 1.92 million gain outside the major metros, the major metro loss of 1.92 million was 3.84 million relative to the gain outside the major metros. This rising “net migration gap” is illustrated in Figure 1. By comparison in the first three years of the last decade (2011-2013), the major metros gained 352,000 net domestic migrants, indicating a drop of 2.27 million relative to 2021-3.
Moving from the Urban Cores to the Suburbs and Beyond: There has also been a significant change in net domestic migration from the major metro urban core counties within the major metros. The urban core counties include the city hall of the core municipality (Note), with the exception of New York, where all five of the city’s counties are considered urban core counties. People are migrating out of urban core counties at a considerably higher rate, while suburban counties are gaining net domestic migrants (overall).
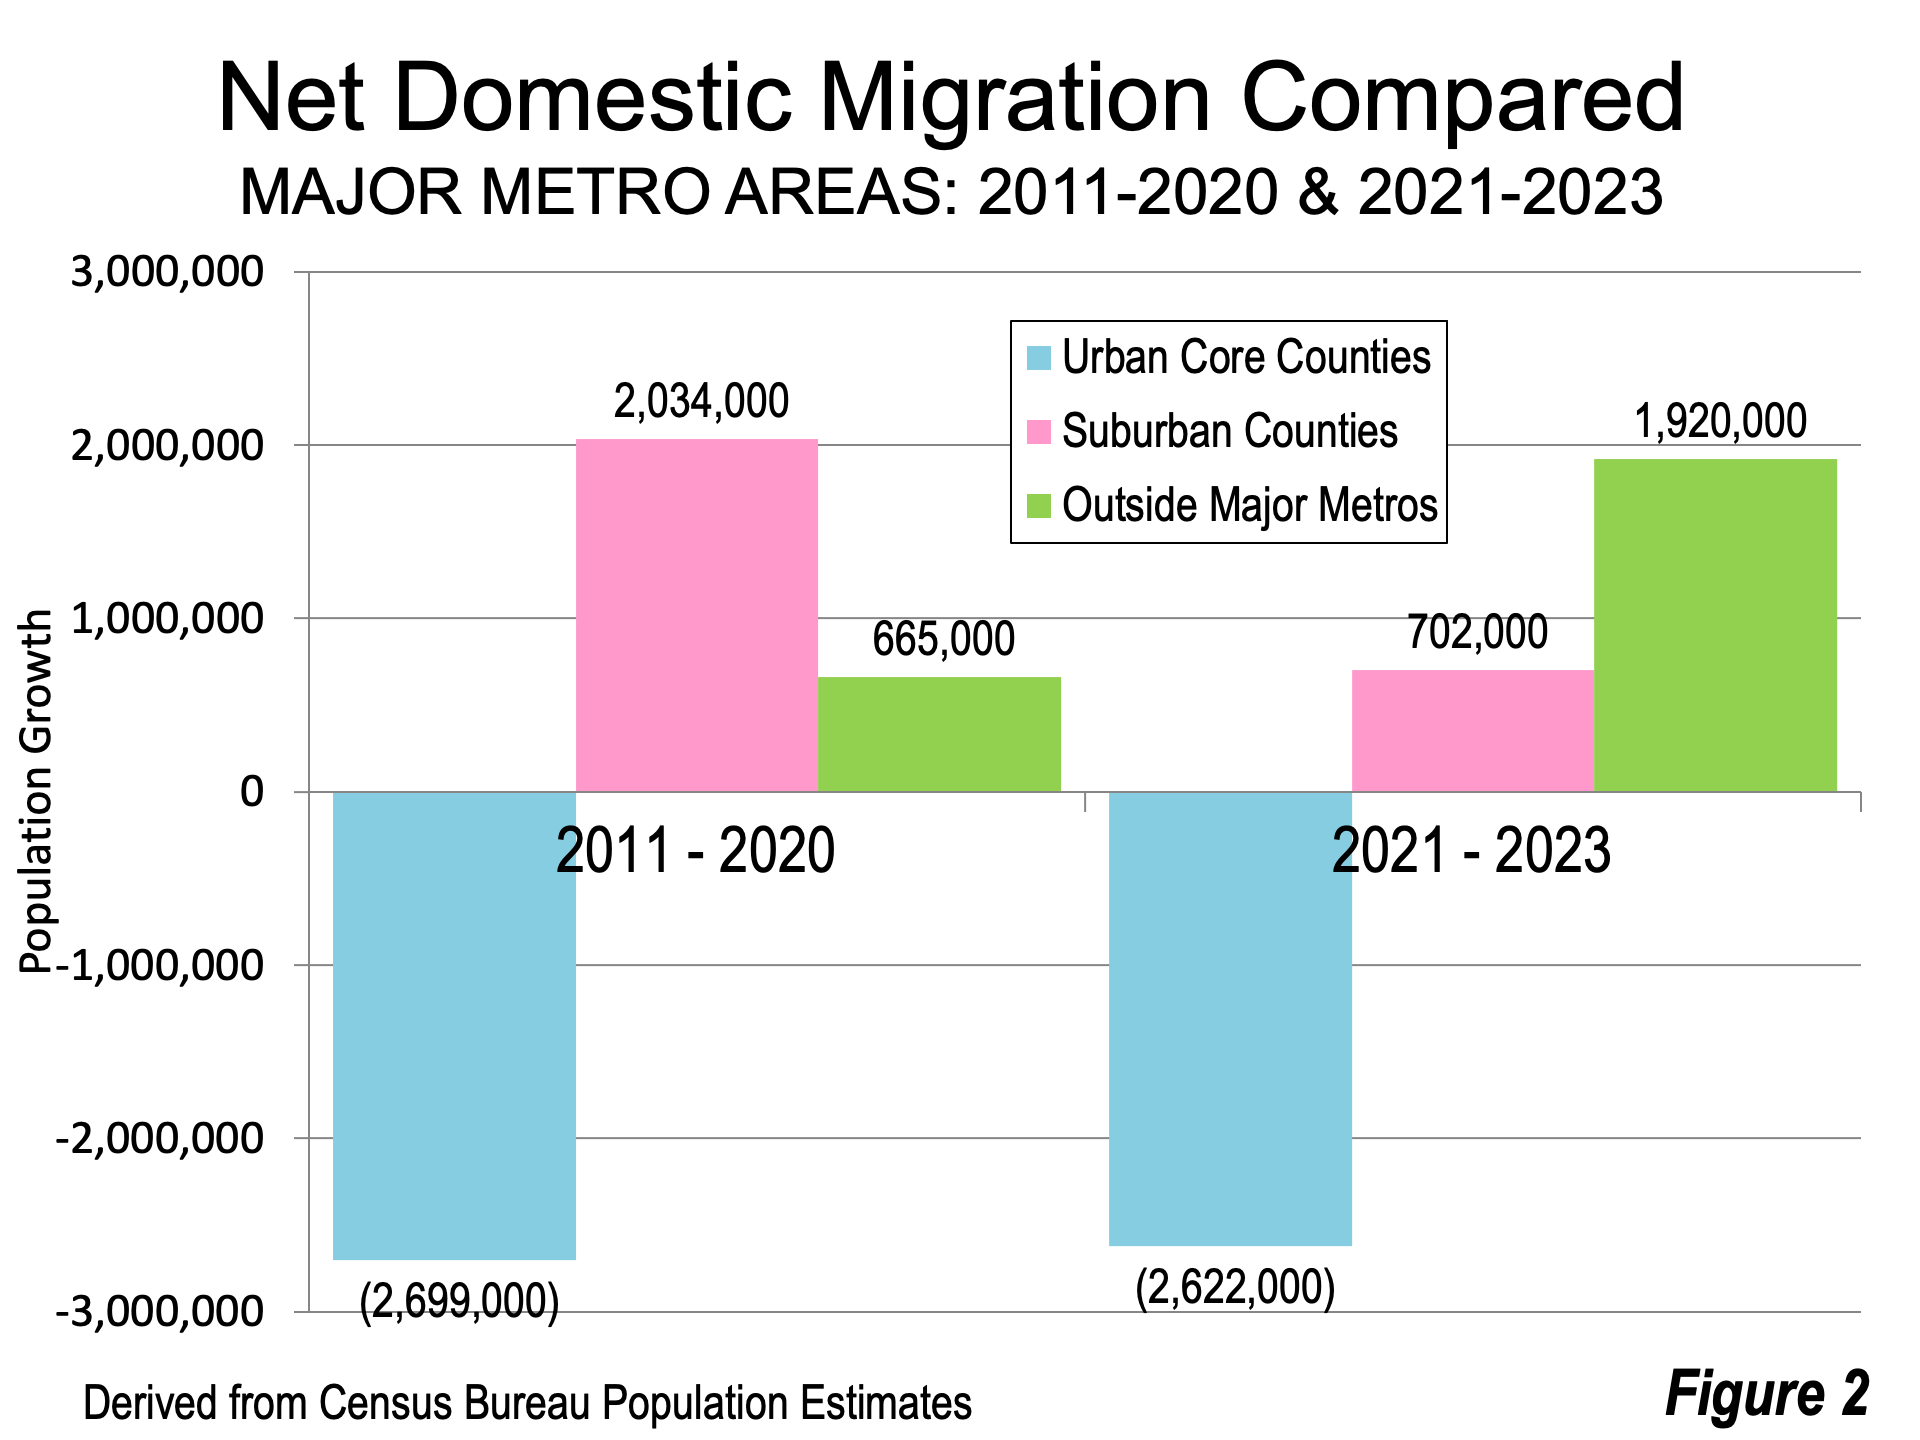
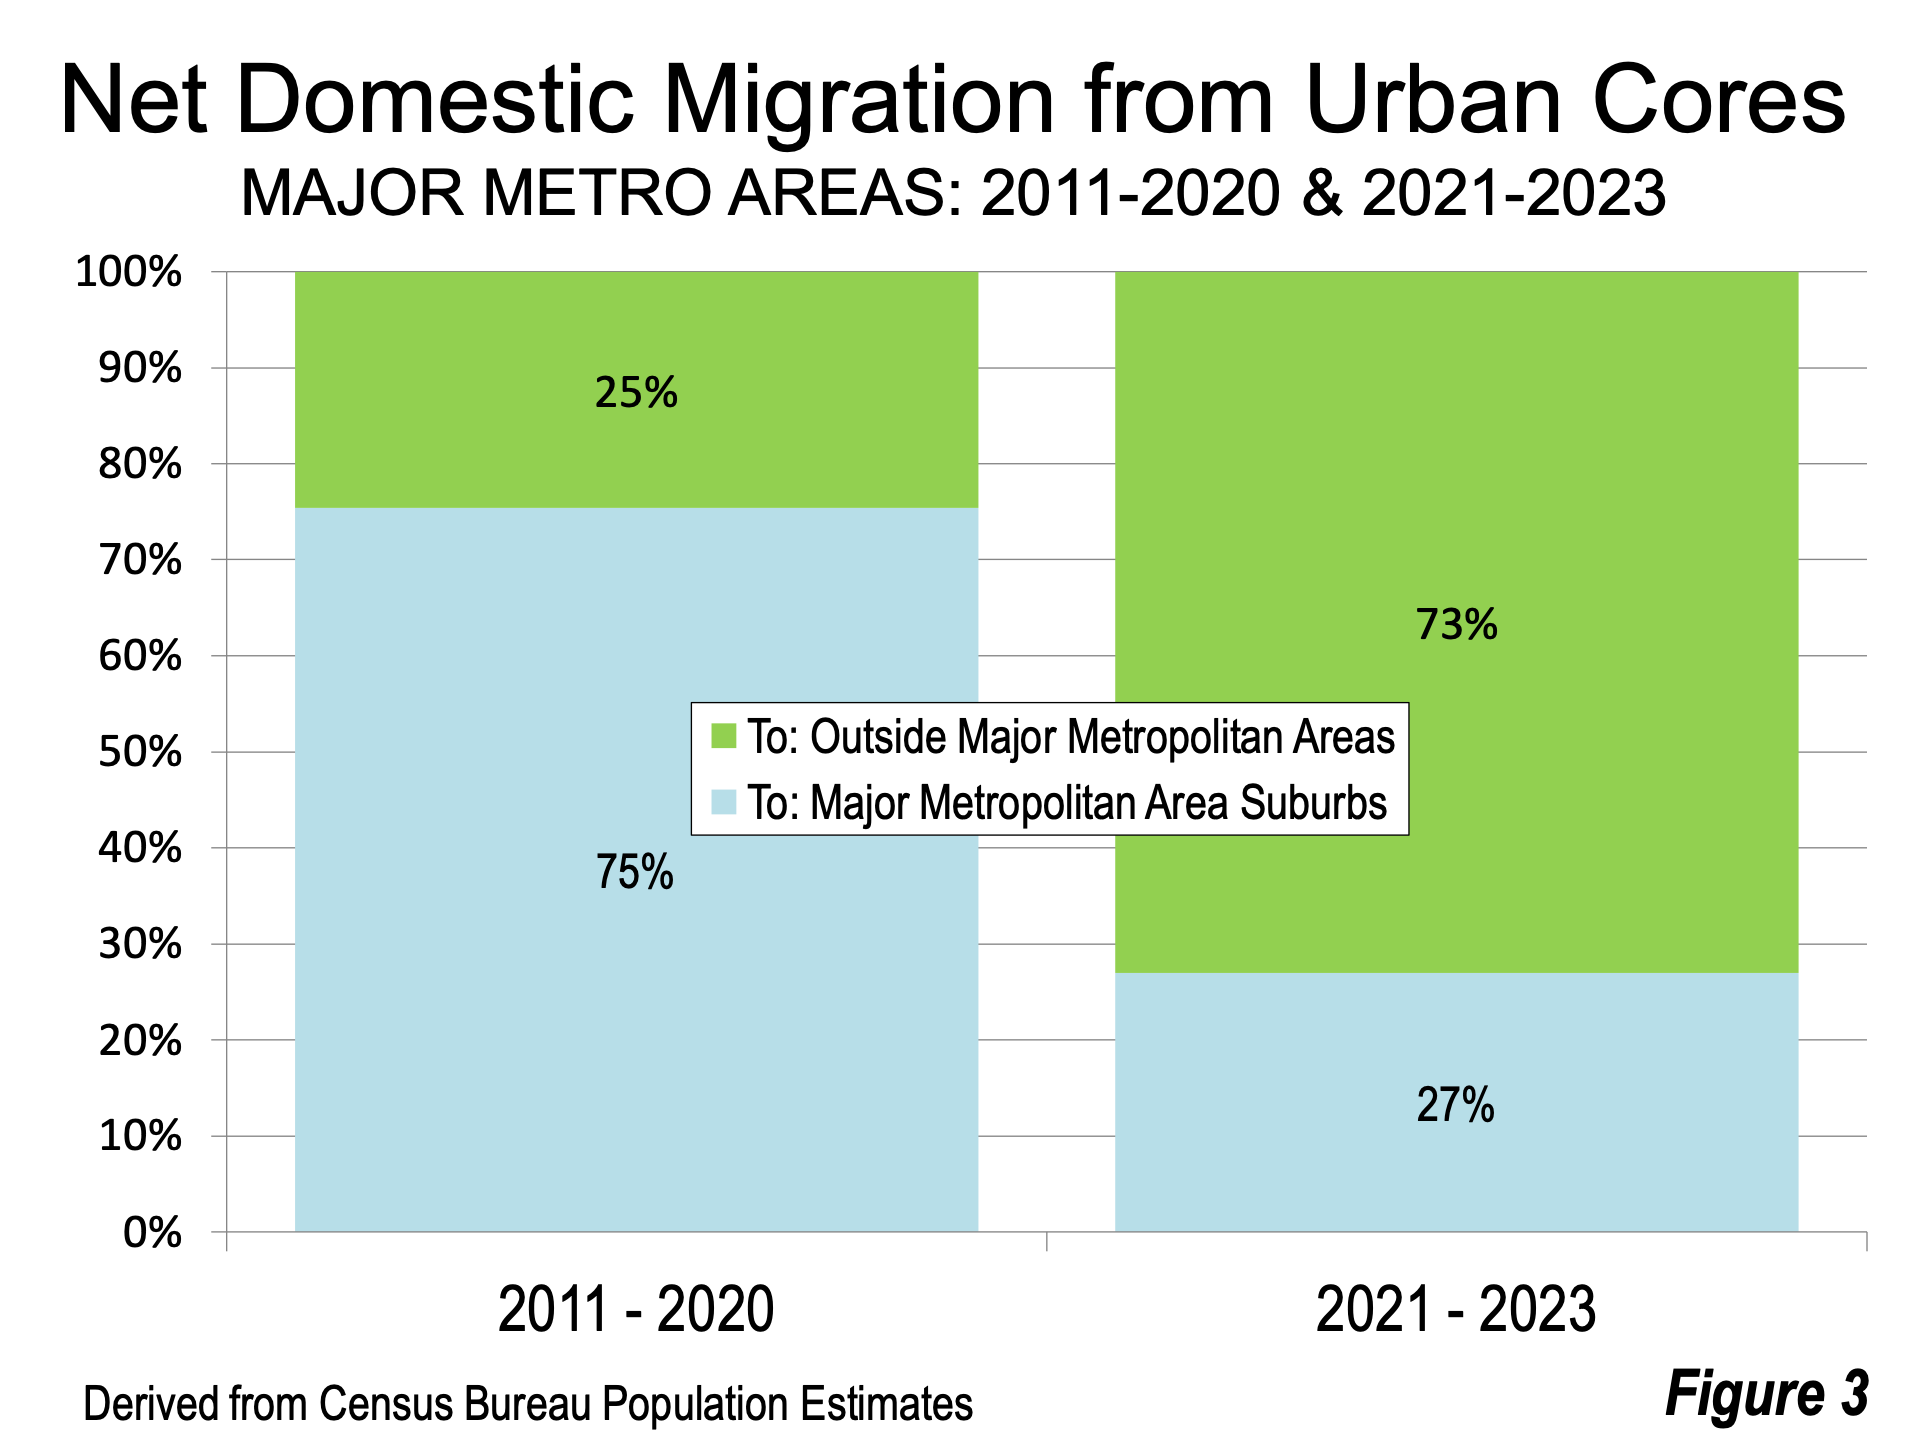
Net domestic outmigration from the urban core counties was 2.6 million from 2021 to 2023. This is nearly equal to the 2.7 million for the entire 2011-2020 decade. Further, urban core net domestic migration was offset somewhat by major metro suburbs (75%) in the 2010s (Figure 2). But this phenomenon seems to have stalled. By 2021-2023 net domestic migration was only 27% to major metro suburbs (Figure 3)
Major Metropolitan Areas Summary: Designated based upon commuting data by the Office of Management and Budget, metropolitan areas are composed of complete counties. The latest delineation of counties within metropolitan areas was in July 2023.
Overall, the 56 major metropolitan areas accounted for 56.8% of the nation’s population in 2023, with 43.2% outside the major metropolitan areas. Detailed population and domestic migration data is in the Table, which includes all 56 metropolitan areas with at least 1,000,000 residents in the 2020 census.
Major Metropolitan Areas — Notable Recent Changes: Some counties were removed in July 2023 from major metropolitan areas, as working from home reduced the number of commuters crossing into interior counties from more remote counties. These areas are no longer suburbs or even exurbs of large metro areas.
Two of those metropolitan areas have fallen below 1,000,000 population since then, including Honolulu and New Orleans. The population reduction in New Orleans was principally the result of removing St. Tammany Parish (county) to become its own metropolitan area (Slidell, LA).
Further, Pike County, Pennsylvania was removed from the New York metropolitan area, reducing that metropolitan area to two states, New York, and New Jersey.
The Chicago metropolitan area lost Kenosha County, Wisconsin, the only part of Wisconsin that had been included in the Chicago metro.
The Top 15 Major Metropolitan Areas: 2021 to 2023: The largest net domestic migration loss over the past three years (2021-2023) was in the New York metropolitan area, which fell by 910,000. Most of this loss occurred within the urban core (the five boroughs of New York), with a net 689,000 moving away. While the suburbs lost 221,000.
- Overall, the New York metro lost 492,000 residents, including net domestic migrants, natural increase (births minus deaths) and net international migration.
- The Los Angeles metropolitan area lost 554,000 net domestic migrants, of which 457,000 left the urban core, while the suburban loss was 96,000. The overall population loss was 379,000.
- The Chicago metropolitan area lost 290,000 net domestic migrants, of which 247,000 left the urban core. The suburban loss was 43,000. The overall population loss was 173,000.
- The Dallas-Fort Worth metropolitan area gained 214,000 net domestic migrants, though the urban core lost 95,0000. The suburban gain was 309,000. The overall population gain was 434,000, which narrowed the gap with third ranked Chicago by 419,000. The Dallas-Fort Worth metropolitan area now trails Chicago by 1,150,000.
- The Houston metropolitan area gained 103,000 net domestic migrants, though the urban core lost 83,000. The suburban gain was 186,000. Overall, the Houston metro gained 342,000 residents.
- The Atlanta metropolitan area has become the sixth largest in the nation. Metro Atlanta gained 69,000 net domestic migrants, though the urban core lost 13,000. The suburban gain was 82,000. Overall, Atlanta gained 198,000 residents.
- The Washington metropolitan area had a net domestic migration loss of 158,000 net domestic migrants, and the urban core lost 13,000. The suburban loss was 143,000. Overall, Washington gained 45,000 residents.
- The Philadelphia metropolitan area had a net domestic migration loss of 52,000 and the urban core lost 78,000, while the suburbs gained 25,000. Overall, Philadelphia gained 4,000 residents.
- The Miami metropolitan area had a net domestic migration loss of 147,000 and the urban core lost 127,000. The suburban counties lost 20,000. Overall, Miami gained 50,000 residents, due to a large net international migration.
- The 10th ranked Phoenix metropolitan area had a net domestic gain of 129,000 and the urban core gained 78,000. The suburbs gained 51,000. Overall, Phoenix gained 195,000 residents. The urban core county, Maricopa, is largely suburban in form, giving it the capacity to attract domestic migrants by virtue of its large land supply.
- The Boston metropolitan area had a net domestic migration loss of 128,000 and the urban core lost 60,000. The suburbs lost 68,000. Overall, Boston lost 15,000 residents.
- The Riverside-San Bernardino metropolitan area had a net domestic migration gain of 49,000 and the urban core lost 17,000. The suburbs gained 67,000. Riverside-San Bernardino passed San Francisco during the 2010s to become California’s second largest metropolitan area. Overall, Riverside-San Bernardino gained 82,000 residents.
- The San Francisco metropolitan area had a net domestic migration loss of 270,000 and the urban core lost 73,000. The suburbs lost 197,000. Overall, San Francisco metro lost 174,000 residents.
- The Detroit metropolitan area had a net domestic migration loss of 270,000 and the urban core lost 73,000. The suburbs lost 18,000. Overall, Detroit lost 43,000 residents.
- The Seattle metropolitan area had a net domestic migration loss of 87,000 . The urban core lost 74,000. The suburbs lost 12,000. Overall, Seattle gained 17,000 residents due to strong net international migration.
Among the 15 largest metropolitan areas, only five gained net domestic migrants in the years from 2021 to 2023 (Dallas-Fort Worth, Houston, Atlanta, Phoenix, and Riverside-San Bernardino). Only one of the 15 largest metropolitan areas had a core county net domestic migration increase (Phoenix). Finally, only six of the top 15 metropolitan areas gained suburban net domestic migration: Dallas-Fort Worth, Houston, Atlanta, Philadelphia, Phoenix, and Riverside-San Bernardino. Philadelphia is particularly surprising, being the only among the top 15 outside the South and outside comparatively the Phoenix and Riverside-San Bernardino metros, which have gained substantially from the flood of outmigration from the Los Angeles metros.
Note: The core municipality is the historical core municipality (https://www.newgeography.com/content/002401-suburbanized-core-cities) which the original metropolitan area was delineated. This is generally the largest municipality in the metropolitan area, except in Riverside-San Bernardino, where San Bernardino County is the urban core county and Virginia Beach-Norfolk, where the urban core county is the independent city of Norfolk.
Wendell Cox is principal of Demographia, an international public policy firm located in the St. Louis metropolitan area. He is a founding senior fellow at the Urban Reform Institute, Houston, a Senior Fellow with the Frontier Centre for Public Policy in Winnipeg and a member of the Advisory Board of the Center for Demographics and Policy at Chapman University in Orange, California. He has served as a visiting professor at the Conservatoire National des Arts et Metiers in Paris. His principal interests are economics, poverty alleviation, demographics, urban policy and transport. He is co-author of the annual Demographia International Housing Affordability Survey and author of Demographia World Urban Areas.
Mayor Tom Bradley appointed him to three terms on the Los Angeles County Transportation Commission (1977-1985) and Speaker of the House Newt Gingrich appointed him to the Amtrak Reform Council, to complete the unexpired term of New Jersey Governor Christine Todd Whitman (1999-2002). He is author of War on the Dream: How Anti-Sprawl Policy Threatens the Quality of Life and Toward More Prosperous Cities: A Framing Essay on Urban Areas, Transport, Planning and the Dimensions of Sustainability.
Photo: aerial view of urban core of Phoenix, Arizona; the only one of top 15 metros with an urban core gain from 2020 to 2023. Via Flickr under CC 2.0 License.
Table 1 (back to reference)
| Population & Net Domestic Migration: 2020-2023 | ||||||
| Major Metropolitan Areas (Over 1,000,000 in 2020 Census) | ||||||
| Population | Net Domestic Migration: 2021-2023 | |||||
| Metropolitan Areas | Population 2020 | Population 2023 | Change | Total | Urban Core Counties | Suburban Counties |
| New York, NY-NJ | 19,990,547 | 19,498,249 | -492,298 | -910,071 | -689,486 | -220,585 |
| Los Angeles, CA | 13,178,547 | 12,799,100 | -379,447 | -553,535 | -457,473 | -96,062 |
| Chicago, IL-IN | 9,435,217 | 9,262,825 | -172,392 | -289,696 | -246,623 | -43,073 |
| Dallas-Fort Worth, TX | 7,666,418 | 8,100,037 | 433,619 | 214,047 | -95,270 | 309,317 |
| Houston, TX | 7,168,723 | 7,510,253 | 341,530 | 103,164 | -82,807 | 185,971 |
| Atlanta, GA | 6,120,849 | 6,307,261 | 186,412 | 69,302 | -12,732 | 82,034 |
| Washington, DC-VA-MD-WV | 6,260,311 | 6,304,975 | 44,664 | -157,731 | -12,977 | -144,754 |
| Philadelphia, PA-NJ-DE-MD | 6,241,967 | 6,246,160 | 4,193 | -52,229 | -77,523 | 25,294 |
| Miami, FL | 6,133,365 | 6,183,199 | 49,834 | -147,014 | -127,096 | -19,918 |
| Phoenix, AZ | 4,875,246 | 5,070,110 | 194,864 | 129,045 | 78,148 | 50,897 |
| Boston, MA-NH | 4,933,650 | 4,919,179 | -14,471 | -128,197 | -60,131 | -68,066 |
| Riverside-San Bernardino, CA | 4,606,384 | 4,688,053 | 81,669 | 30,117 | -16,727 | 46,844 |
| San Francisco, CA | 4,740,838 | 4,566,961 | -173,877 | -270,467 | -73,308 | -197,159 |
| Detroit, MI | 4,385,248 | 4,342,304 | -42,944 | -69,183 | -51,272 | -17,911 |
| Seattle, WA | 4,027,804 | 4,044,837 | 17,033 | -86,587 | -74,277 | -12,310 |
| Minneapolis-St. Paul, MN-WI | 3,694,114 | 3,712,020 | 17,906 | -47,494 | -48,905 | 1,411 |
| San Diego, CA | 3,187,828 | 3,342,963 | 155,135 | 136,705 | 30,900 | 105,805 |
| Tampa-St. Petersburg, FL | 3,295,298 | 3,269,973 | -25,325 | -80,442 | -80,442 | 0 |
| Denver, CO | 2,970,119 | 3,005,131 | 35,012 | -15,396 | -15,482 | 86 |
| Baltimore, MD | 2,842,668 | 2,834,316 | -8,352 | -37,806 | -21,878 | -15,928 |
| Charlotte, NC-SC | 2,680,491 | 2,817,933 | 137,442 | 61,532 | -15,784 | 77,316 |
| Orlando, FL | 2,669,651 | 2,805,115 | 135,464 | 85,546 | 3,864 | 81,682 |
| St. Louis,, MO-IL | 2,819,212 | 2,796,999 | -22,213 | -25,137 | -21,228 | -3,909 |
| San Antonio, TX | 2,568,526 | 2,703,999 | 135,473 | 95,056 | 33,107 | 61,949 |
| Portland, OR-WA | 2,518,160 | 2,508,050 | -10,110 | -31,565 | -31,870 | 305 |
| Sacramento, CA | 2,300,135 | 2,473,275 | 173,140 | 103,858 | -6,547 | 110,405 |
| Austin, TX | 2,455,323 | 2,422,725 | -32,598 | -11,178 | -23,896 | 12,718 |
| Pittsburgh, PA | 2,400,029 | 2,420,608 | 20,579 | -15,783 | -33,164 | 17,381 |
| Las Vegas, NV | 2,274,887 | 2,336,573 | 61,686 | 35,608 | 35,608 | 0 |
| Cincinnati, OH-KY-IN | 2,251,974 | 2,271,479 | 19,505 | -1,125 | -14,213 | 13,088 |
| Kansas City, MO-KS | 2,195,218 | 2,221,343 | 26,125 | 2,911 | -5,203 | 8,114 |
| Columbus, OH | 2,141,895 | 2,180,271 | 38,376 | -2,229 | -35,321 | 33,092 |
| Cleveland, OH | 2,184,115 | 2,158,932 | -25,183 | -21,274 | -30,447 | 9,173 |
| Indianapolis. IN | 2,092,745 | 2,138,468 | 45,723 | 11,496 | -32,405 | 43,901 |
| Nashville, TN | 2,021,744 | 2,102,573 | 80,829 | 51,650 | -21,844 | 73,494 |
| San Jose, CA | 1,995,698 | 1,945,767 | -49,931 | -116,531 | -119,136 | 2,605 |
| Virginia Beach-Norfolk, VA-NC | 1,781,712 | 1,787,169 | 5,457 | -12,477 | -10,967 | -1,510 |
| Providence, RI-MA | 1,612,981 | 1,713,240 | 100,259 | 83,132 | 15,328 | 67,804 |
| Jacksonville, FL | 1,673,216 | 1,677,803 | 4,587 | -5,399 | -9,883 | 4,484 |
| Milwaukee,WI | 1,574,476 | 1,560,424 | -14,052 | -27,049 | -35,441 | 8,392 |
| Raleigh, NC | 1,417,455 | 1,509,231 | 91,776 | 58,023 | 29,426 | 28,597 |
| Oklahoma City, OK | 1,429,940 | 1,477,926 | 47,986 | 32,539 | -1,193 | 33,732 |
| Louisville, KY-IN | 1,362,955 | 1,365,557 | 2,602 | -2,870 | -16,705 | 13,835 |
| Memphis, TN-MS-AR | 1,316,646 | 1,349,732 | 33,086 | 20,664 | -1,990 | 22,654 |
| Richmond, VA | 1,346,172 | 1,335,674 | -10,498 | -19,114 | -29,713 | 10,599 |
| Salt Lake City, UT | 1,260,338 | 1,267,864 | 7,526 | -25,522 | -32,429 | 6,907 |
| Birmingham, AL | 1,181,776 | 1,184,290 | 2,514 | 3,199 | -11,910 | 15,109 |
| Fresno, CA | 1,165,897 | 1,180,020 | 14,123 | -7,645 | -4,609 | -3,036 |
| Grand Rapids, MI | 1,151,502 | 1,162,950 | 11,448 | -2,717 | -8,899 | 6,182 |
| Buffalo, NY | 1,164,468 | 1,155,604 | -8,864 | -9,590 | 2,693 | -12,283 |
| Hartford, CT | 1,135,704 | 1,151,543 | 15,839 | 5,960 | 2,693 | 3,267 |
| Tucson, AZ | 1,045,175 | 1,063,162 | 17,987 | 16,939 | 16,939 | 0 |
| Rochester, NY | 1,062,841 | 1,052,087 | -10,754 | -13,967 | -13,306 | -661 |
| Tulsa, OK | 1,017,350 | 1,044,757 | 27,407 | 20,212 | 2,996 | 17,216 |
| Honolulu, HI | 1,012,399 | 989,408 | -22,991 | -38,743 | -38,743 | 0 |
| New Orleans. LA | 1,005,281 | 962,165 | -43,116 | -55,489 | -22,529 | -32,960 |
| Total | 189,043,228 | 190,302,622 | 1,259,394 | -1,920,547 | -2,622,082 | 701,535 |
| United States | 332,048,977 | 334,914,895 | 2,865,918 | 0 | ||
| Balance of the United States | 143,005,749 | 144,612,273 | 1,606,524 | 1,920,547 | ||
| Derived from US Census Bureau Data | ||||||


Tri-state
Stamford-Greenwich CT is a separate metro from NYC?